How to build a project in the flowchart editorExample - create a model of sugar crystallization using the flowchart editor Tip:
you can follow this tutorial with the flowchart editor
using example project: Sugar crystallization!
Purify sugar from it's impurities by clarification with activated carbon, and crystallization according to the following recipe: Dissolve 80 kg crude sugar in 100 litres of water (on about 90°C), and clarify it with 5 kg of activated carbon. Then filter off the hot mixture. Cool down the filtrate (crystallization begins) and add 50 litres of ethanol to it (more sugar precipitates because of the weaker solubility in alcohol). Then filter the sugar crystals, and wash the filter cake with 10 litres ethanol. 1st: Define materials!So, we have some input and output materials. Go to the Materials page and create 8 rows end enter the names and symbols of the materials, and set the type of them, too: 
If you push a ![[NAME-->] labelled button [NAME-->]](figures/tutorial_edit_project_materials_3.jpg) labelled button, the component in this row will inherit the name of
the material (only in case of input materials with 1 component):
labelled button, the component in this row will inherit the name of
the material (only in case of input materials with 1 component):

2nd: Define components and densities!Since the material flow calculations operate in mass unit (kg) and the recipe could contain volumetric data (litre) setting the correct density values of each component is definitely necessary. Click on the composition field of an input material (right end of each row) to access the composition editor table. The program automatically defines 1 component with a default name and a default density value (1 kg/dm3) for each input material. Clicking on the default compound name a drop-down list must be appear. 
The first 3 options mean:
The further options are selectable compounds. (I.e.: the entire current compound list of this project.) Note: The program inhibits multiple compound selections. So, go to the composition table of material called "crude sugar", and edit these rows:

Select the row of the "sugar" component and click on the [MARK AS COMPOUND OF INTEREST] button. The name of this compound became bold. This type of marking hepls the program creating more consistent flowchart. 
Close the composition editor table and find the little ![Key button for defining starting materials and target products [Key button]](keybutton_base.png) in the material table. This button represents that a
material has one or more key compounds. So set the "crude sugar"
input material to "starting material" by pushing this little button.
This setting gets the program to know that our attention is
focused on this material. (The project "is about the sugar".)
in the material table. This button represents that a
material has one or more key compounds. So set the "crude sugar"
input material to "starting material" by pushing this little button.
This setting gets the program to know that our attention is
focused on this material. (The project "is about the sugar".)
now go on with the compound definition of the further input materials (activated carbon and ethanol). (Note that components can be defined only for input materials, because the compositions of output materials are results of the process simulation.) 3rd: Define equipment!On the [Equipment] worksheet you can define the appliances used in your project. The fields of this table are for:

4th: Define operations!After definitions of materials and equipment you can switch to the [Operations] worksheet and edit each operation step by step according to the recipe.

Note that there is no need for defining a "dissolution" or "homogenization" operation since the program handles the actual content of a vessel as a homogenous mixture. In other words: the program does not distinguish solid and liquid and gaseous components. So "dissolution" of a material means simply "loading of it".

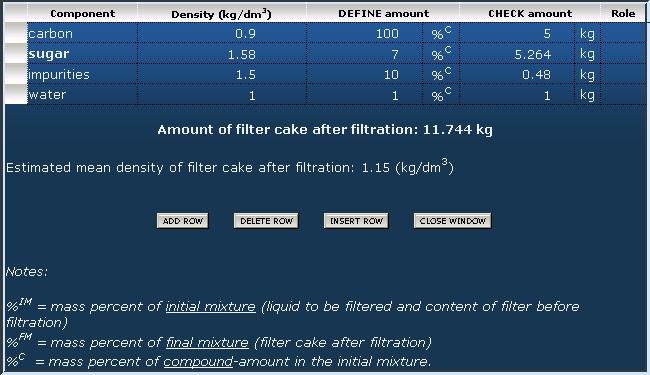
As you can see, there is 2 [EDIT] buttons in the "Details" field (at the end of row). The first button belongs to the "filtered material", and the second one to the "filtrate". Both buttons can be used alternatively for set components to be separated. These settings are complementary definitions, i.e. if components staying on the filter are set, this setting determines the composition of the filtrate, too, and vice versa. The component editor table is very similar to that of the materials table, but this is a little bit more complex. In this case there are 2 composition columns: one for defining amounts, and one for checking amounts in another units. Moreover various percentage units can be used, explanation of them can be found on the bottom of the table. 
Some explanations of the component amounts in this example:
After closing the component editor table the amounts in the main operations table are refreshing (in this case: amount of filtered material and the filtrate). 
This is the principle and all of the other operations are based on this. (Really that is all, it is no great matter.) For more detailed information please find the tutorial examples focusing on operations 5th: Generate technological flowsheet and summarize material amounts!Swith to the [Flowsheet] worksheet to see the generated material flow diagram. You can export this figure by clicking on the [PRINT] button. Swith to the [Materials] table to see the summarized amounts. You can export this table by clicking on the [PRINT] button. Page top Home |
Useful tools
ChemSpider
Physico-chemical properties of compounds determined experimantally and/or by calculations.
Engineering ToolBox
The boiling points of some common liquids and gases as acetone, butane, propane, and more |
process-flow-diagram.com -- generate chemical technological flowsheets based on material flow calculations
Privacy policy Last update:

